Create an OSSEC Log Management Console with Kibana
It’s been awhile since Kibana 4 was released, so I figured it was about time I updated my OSSEC Log Management Console to use the latest and greatest Kibana. The look and feel of Kibana has changed quite a bit, with a new data discovery mode that let’s you browse your data quickly before you create any visualizations. The visualization panels are fluidly moveable to any position, query results are displayed very rapidly and you can even embed your dashboards into static web pages with the dashboard export feature.
In this article I’ll go over how to create a security event dashboard with KIbana 4. I’ll forgo discussing the details on setting up Elasticsearch and Logstash since they have been covered in my previous OSSEC log management and logstash blogs. Read those first to get an idea of how the system described here parses OSSEC alert logs and indexes them with Elasticsearch.
Install and Configure Kibana
Upgrade to Elasticsearch >= 1.4.4
Kibana 4.x requires at least Elasticsearch 1.4.4, so you must upgrade to at least that version to use Kibana 4. To upgrade your Elasticsearch to 1.4.4 or later go to the Elasticsearch Downloads page then get the latest Elasticsearch package you need for your cluster’s operating system. I use CentOS 6.6 so I get the RPM packages. Then follow the rolling upgrade procedure described on the Upgrading page.
Installing Kibana 4
Next you want to go back to the Elasticsearch Downloads page and get Kibana 4.x. Kibana 4 has a Node.js server built in. To get it to work with your cluster you just have to set the first three configuration variables in the conf/kibana.yml file:
# Set port to the Kibana listening port - default is 5601
port: 9000

# The host to bind the server to, all IP addresses in this case.
host: "10.0.0.1"

# The Elasticsearch instance to use for all your queries - default is localhost:9200
elasticsearch_url: "http://10.0.0.1:9200"
There are many other settings that are important, including security settings, but for this article I want to focus on dashboard creation.
To start Kibana just go to the bin directory of your where you installed Kibana and run kibana. The built in Node.js server will load all your Kibana stuff so you are ready to go to the console.
Set the Index Pattern
The next step involves connecting Kibana to your Elasticsearch data so queries can be performed. Navigate to you Kibana console in the browser. For the example in this article The URL should be http://10.0.0.1:9000. With the browser open to the Kibana console, click on the Settings tab. You will a screen that looks like the following:
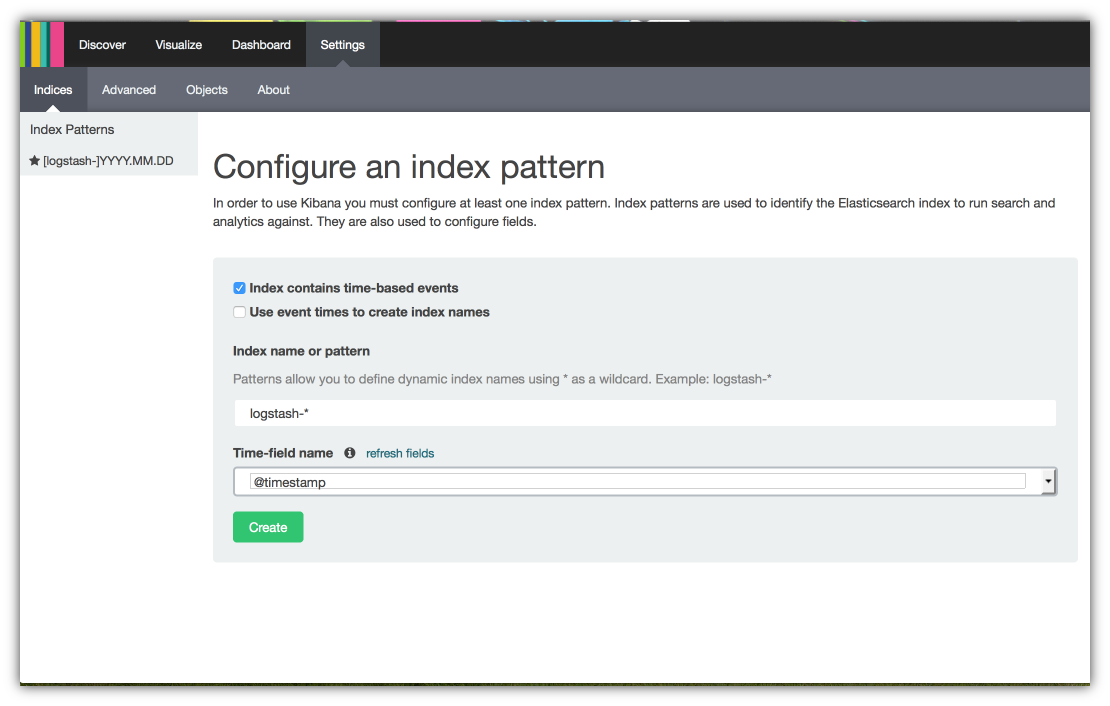
Kibana will automatically search for what look like time series indices in your cluster then display them in this screen. You then choose the one you want and identify the time field. In this example I’m using the logstash index naming convention and @timestamp. When you are happy with you choice click on Create when you are done.
Create OSSEC Visualizations
Dashboard Panels
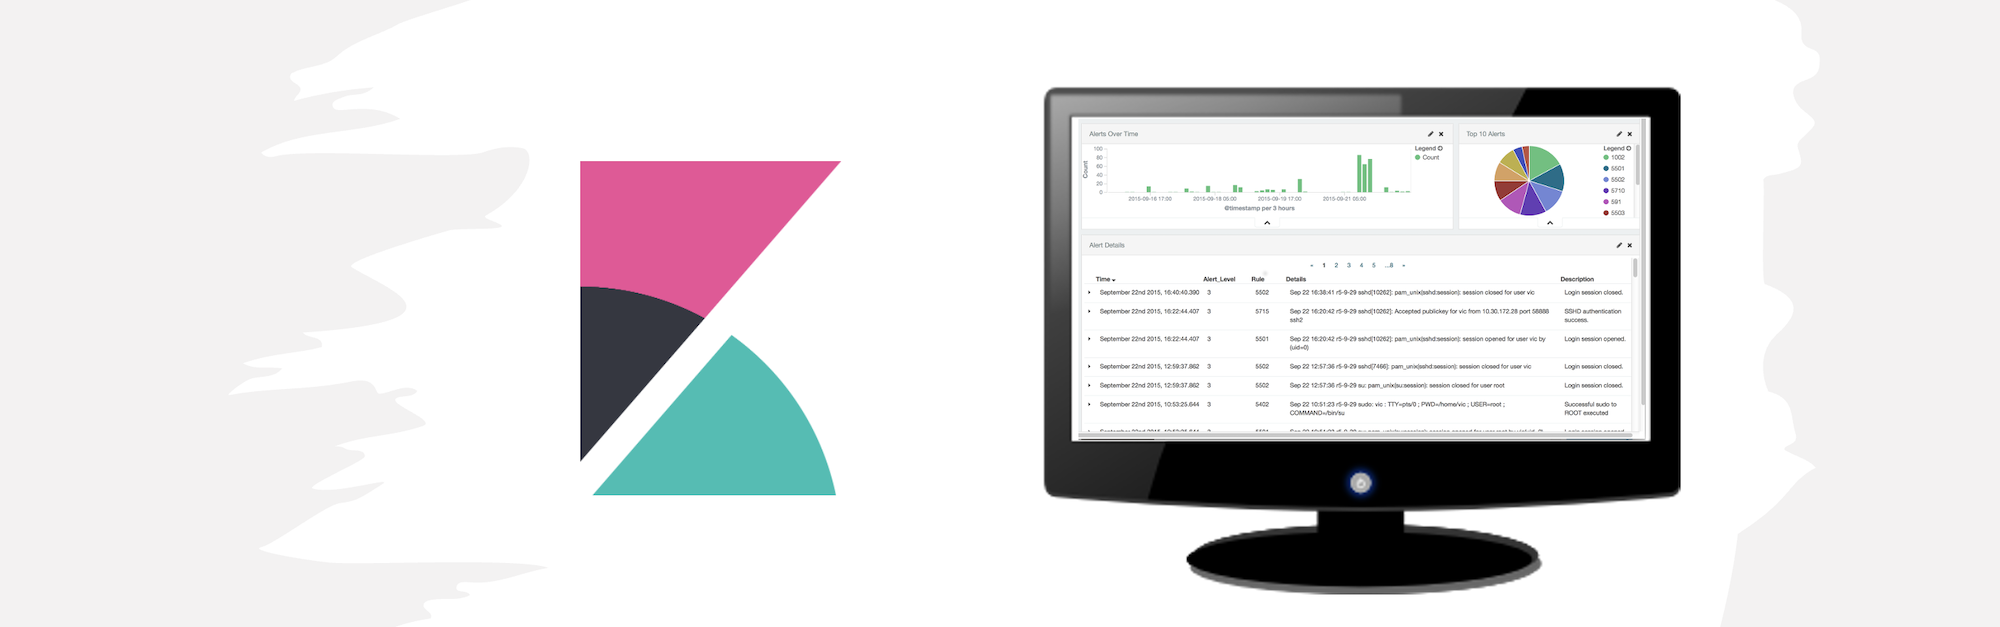
The OSSEC Dashboard will consist of the following 3 panels:
- Table of OSSEC alerts that shows alert fields.
- Bar chart that plots the number of OSSEC alerts over time.
- Pie chart that tracks the Top 10 alerts and shows a percentage breakdown for each alert.
Each of these panels will consist of a visualization that is tied to a search of OSSEC alerts. Visualizations are charts that show the results of aggregation searches.
Alert Table Search
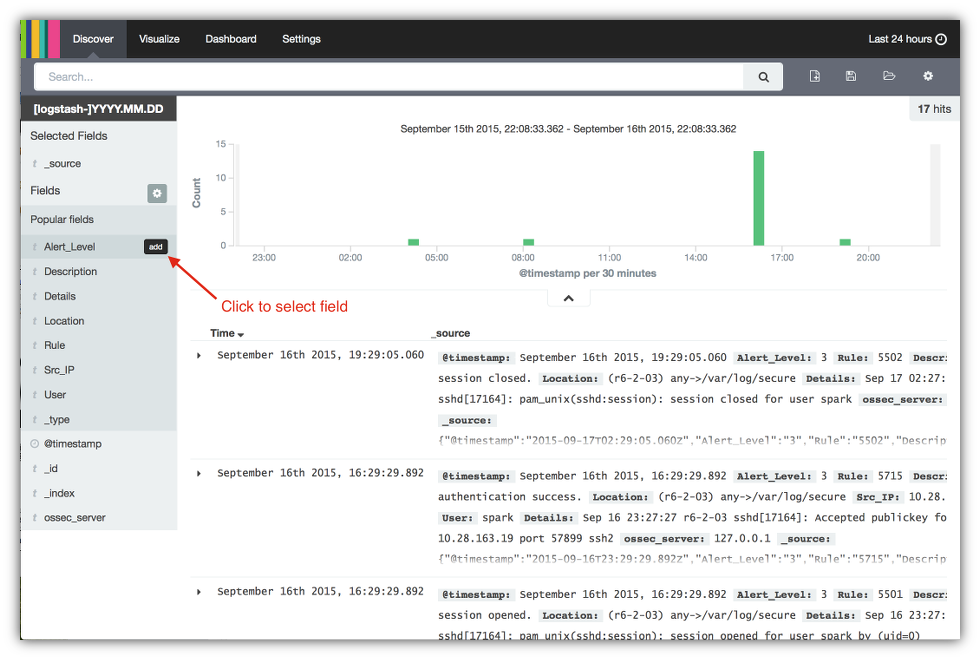
One of the great features of Kibana 4 is the capability to instantly view your data as soon as you identify an index series. When you click on the Discover tab, the discover button at the top of the Kibana console an alert count over time bar chart is displayed at the top of the screen and the raw JSON alert data is displayed at the bottom.
From here you create the search that you will use for your visualizations. Since the discover panel has already done a query for the alert data, all that needs to be done is select the fields that will be included in the search results. Note that the table for the search will be created later when the final dashboard is assembled.
- To a select field for the discovery table, place the cursor to the right of each field you want then click on the add button that appears.
- Repeat step 1 for each field you want. For this blog the Alert_Level, Rule, Descriptions and Details will be added.
- After selecting the fields for your table, you’ll see them appear in the Selected Fields section and in the discovery table itself. Now let’s change the time scale to see the alerts over the past week. Click on the current time range in the upper right hand corner of the console.
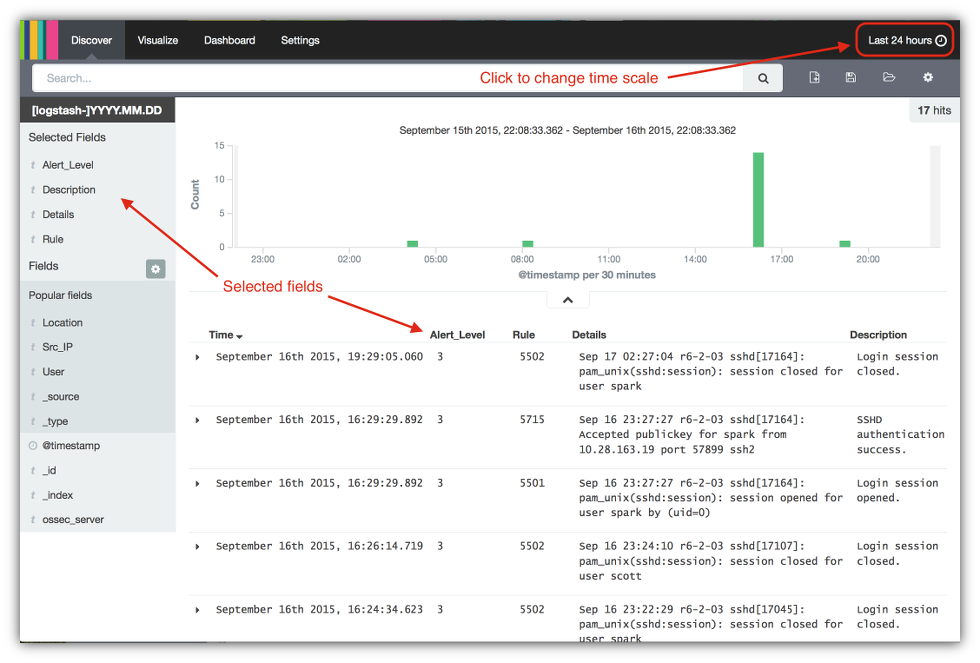
- Click on the link Last 7 days.
- Click on the up arrow control to close this panel.
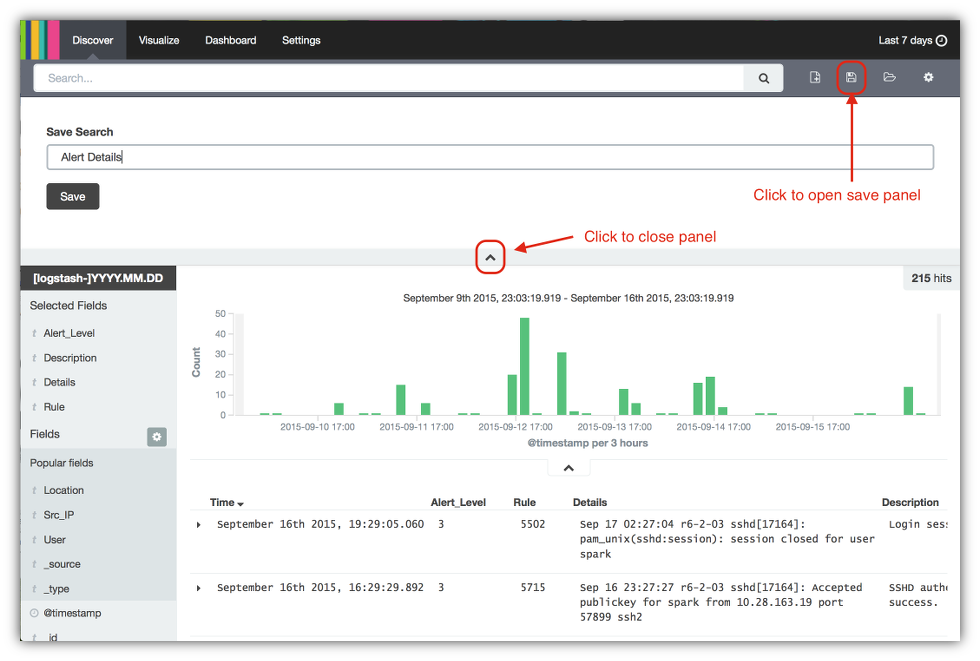
- Finally click on the disk icon in the upper right hand corner of the 7. main console to open the Save Search panel.
- Enter the name of the search as Alert Details.
- Click on the Save button.
- Click on the ^ icon to close the panel.
Alerts Over Time Visualization
The process of creating a visualization starts with picking a chart to represent your data aggregation. For the alerts over time visualization I’ll use a vertical bar chart.
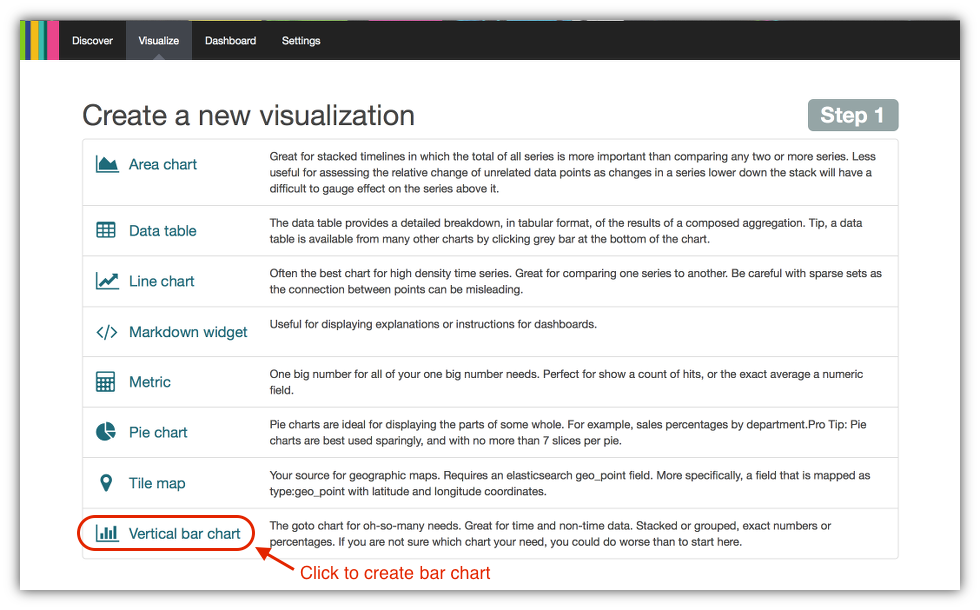
- Click on the Visualize button at the top of the Kibana console.
- Click on Vertical bar chart from the list of choices in the Create a new Visualization panel.
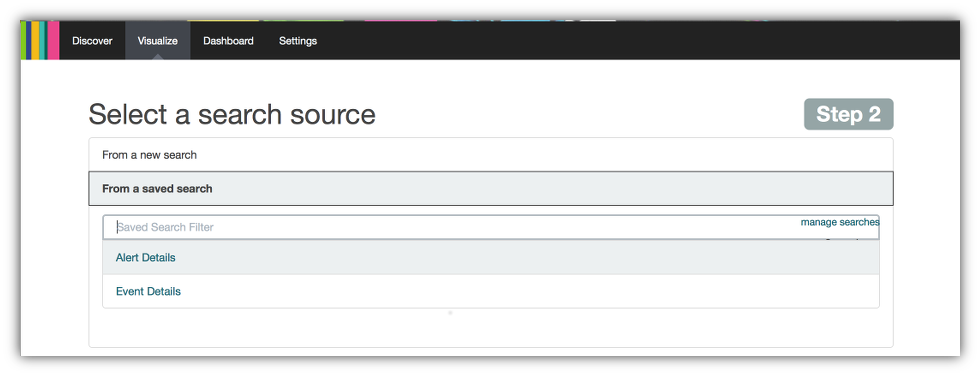
- Kibana will prompt you for a search that you want to use for the bar chart. You can select either a new search or use an existing one. Click on the From a saved search item in the Select a search source panel menu.
- Select the Alert Details search you defined in the previous section.
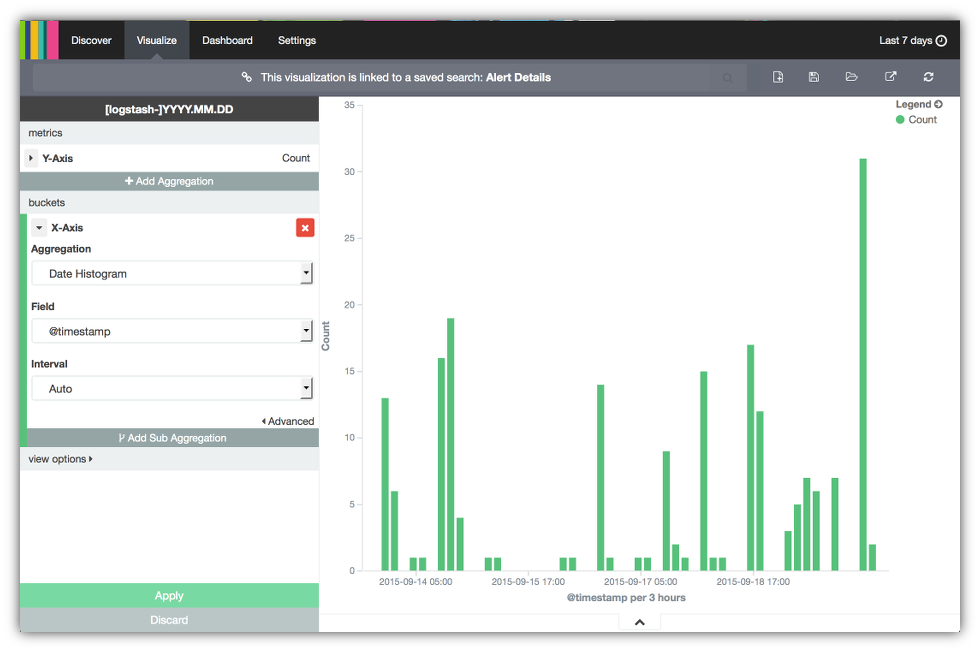
- You will get a screen that looks like the following. Note that Kibana indicates this visualization is linked with the Alert Detail saved search. Click on the
X-Axisunder the Select buckets type section to set up the aggregation for the alerts bar chart visualization where time is plotted on the X-axis.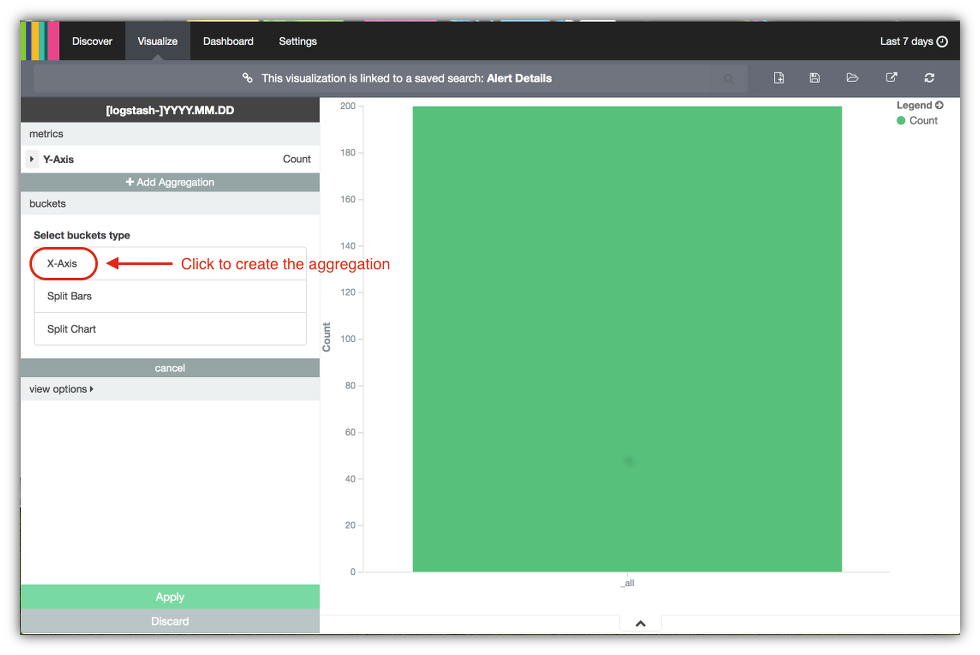
- Select the Date Histogram from the Aggregation menu. Kibana will automatically select the @timestamp field for the X-axis and set the time interval automatically. You can now see alert counts over the last 7 days. Note this interval is based on what you selected previously.
- Click on Apply to run the aggregation search.
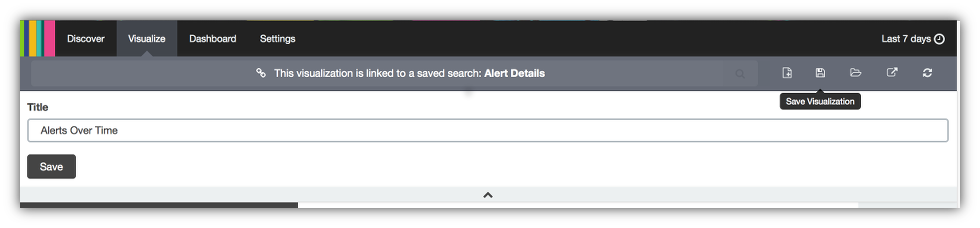
- Now save the visualization by clicking on the disc icon in the upper right hand corner, similar to how the search was saved in step 9 of the previous section.
- Set the visualization name to
Alerts Over Time. - Click on Save.
Top 10 Alerts Visualization
The Top 10 Alerts visualization uses a terms aggregation search. The steps involved are essentially the same as for the bar chart.
- Click on the Visualize button at the top of the Kibana console.
- Click on Pie chart from the list of choices in the Create a new Visualization panel.
- Click on the From a saved search item in the Select a search source panel menu.
- Select the Alert Details search. For the remaining steps refer to the diagram following step 12.
- Click on the X-Axis to set up the aggregation for the Top 10 alerts visualization where 6. time is plotted on the X-axis.
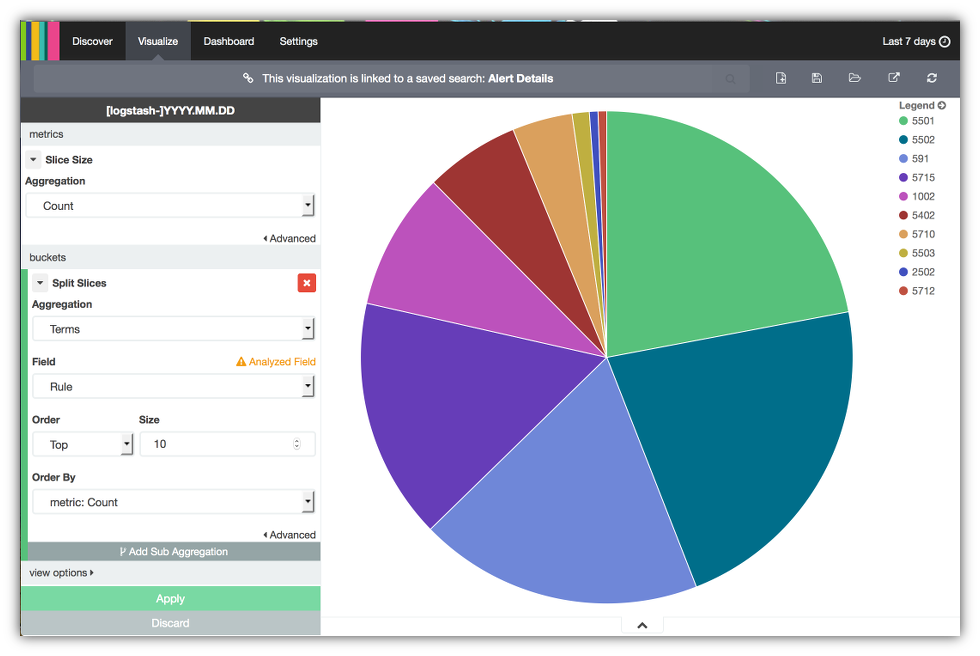
- Click on Split Slices under the Select buckets type section to set up the terms aggregation.
- Select the Terms aggregation under the Aggregation menu.
- Select the Rule field under the Field menu so the aggregation search will use the alert rules.
- Select Top under the Order menu.
- Select 10 under the Size to get the top 10 terms.
- Select metric:Count under the Order By menu.
- Click on Apply to run the top 10 terms aggregation search. You should get a screen that looks something like the following.
- Click on the disc icon in the upper right corner of the Kibana console.
- Set the visualization name to Top 10 Alerts.
- Click on Save.
Create OSSEC Dashboard
The dashboard can now be assembled by combining the saved visualizations that have been created so far.
- Click on the Dashboard button a the top of the Kibana console.
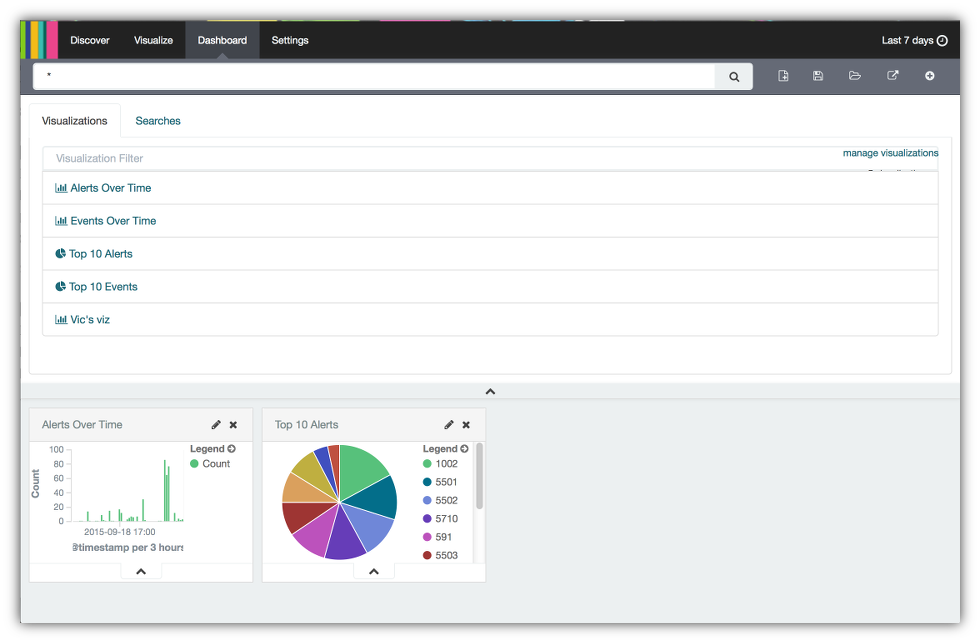
- Click on the Add Visualization icon in the upper right hand corner.
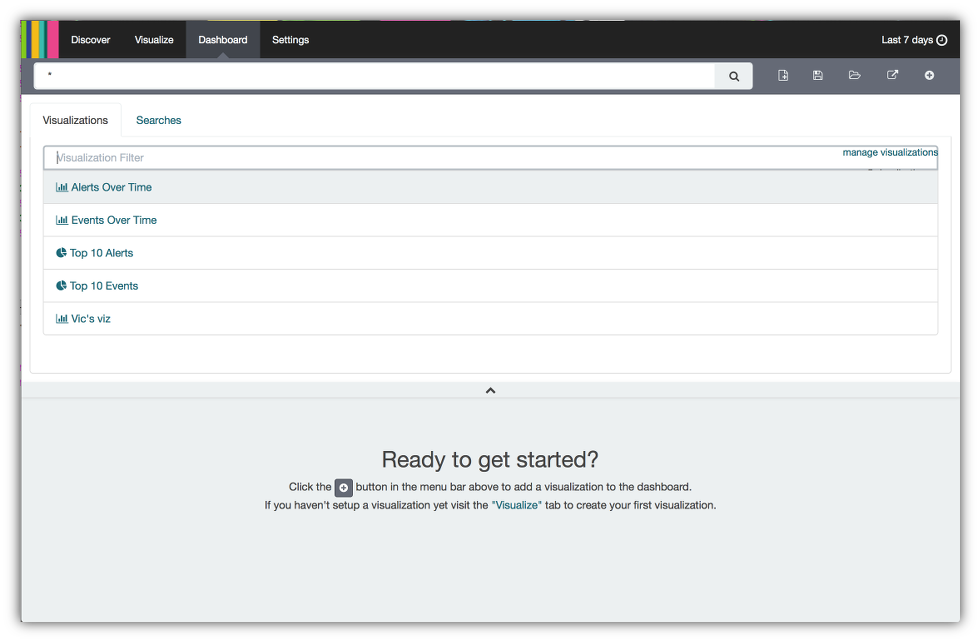
- Select the Alerts Over Time.
- Select the Top 10 Alerts.
- Your dashboard should have two miniature versions of these visualizations which will be resized later. Next click on the Searches tab.
- Select the Alerts Over Time to create a chart that lists the alert details.
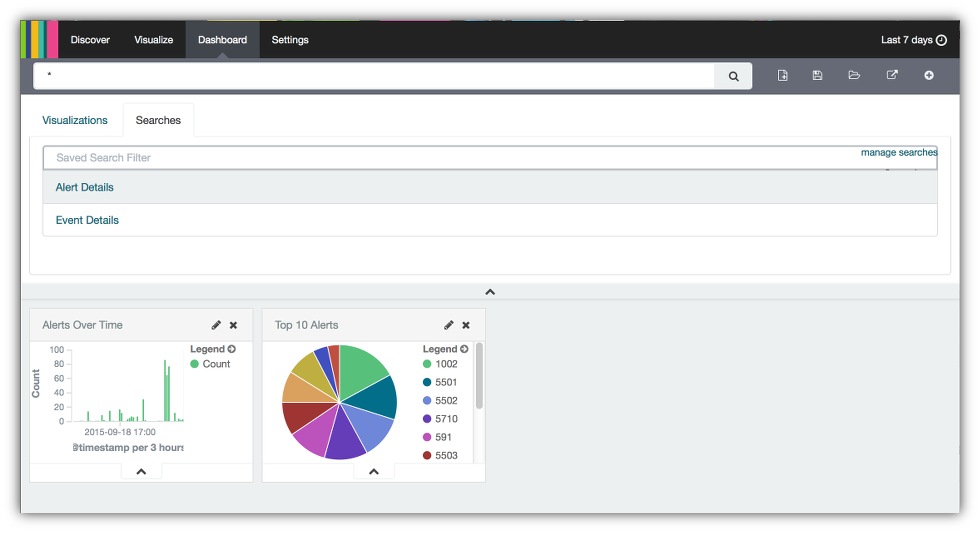
- Now you have a dashboard with the 3 visualizations created in previous sections. To finish up, close the Searches tab by clicking on the ^ icon.
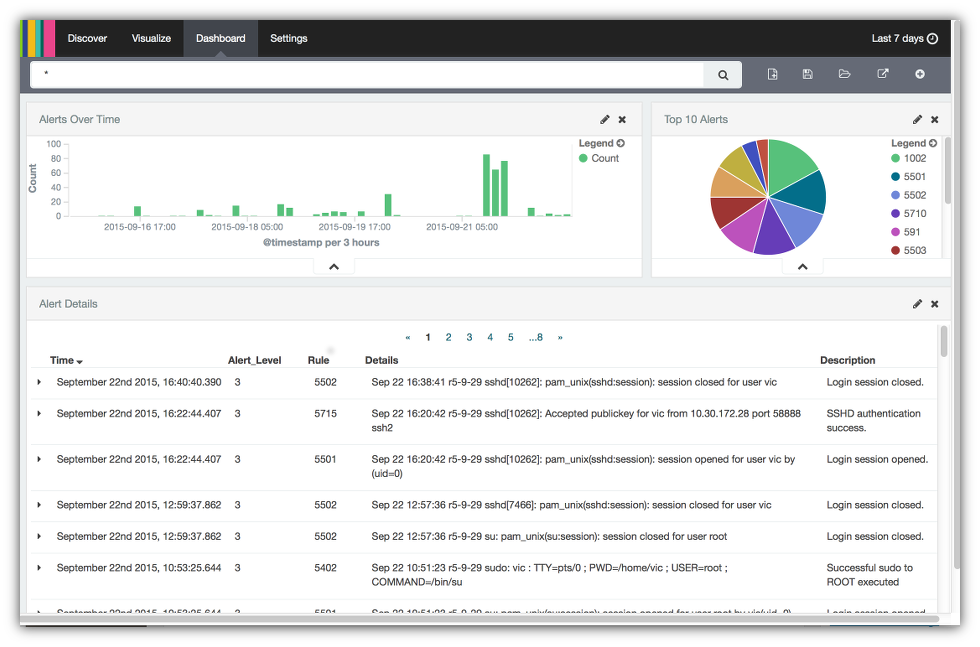
- Each of the visualizations are windows that can be moved by clicking on the top and dragging them to the desired position. You can also resize these windows by clicking in the lower right hand corner of each and dragging the corner to until the window is the desired size. After resizing and repositioning here is the dashboard I created.
- Click on the disc icon in the upper right corner to save the dashboard.
- Save the dashboard as OSSEC Dashboard.
- Click on the Save button.
You now have a fully working Kibana 4 style OSSEC Alerts Dashboard. From here you can share the link to other folks or you can create an iframe of the dashboard to include in other HTML pages. To share a dashboard click on the share icon in the upper right hand corner of the Kibana console.
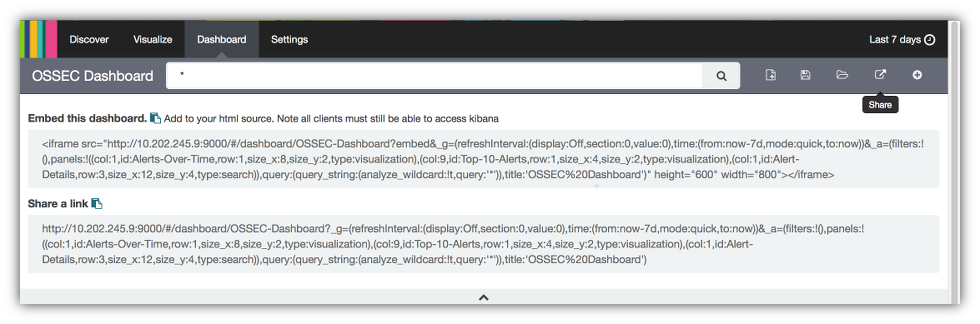
You can then copy the iframe component in the Embed this dashboard field and paste it into a web page or copy the link in the Share a link field and paste into an email.


Leave a comment