
OSSEC Log Management with Elasticsearch
Among the many useful features of OSSEC is its capability to send alerts to any system that can consume syslog data. This makes it easy to combine OSSEC with a number of 3rd party SIEMs to store, search and visualize security events. Splunk for OSSEC is one such system that works on top of the Splunk platform.
Splunk can be expensive though, particularly if you collect a lot of log data. So I’ve been working on a solution for collecting OSSEC security alerts based on Elasticsearch that provides a cost effective alternative to Splunk.
Log Management System Architecture
The OSSEC log management system I’ll discuss here relies on three open source technologies, in addition to OSSEC:
- Logstash – Parses and stores syslog data to Elasticsearch
- Elasticsearch – General purpose indexing and data storage system
- Kibana – User interface that comes with ElasticSearch
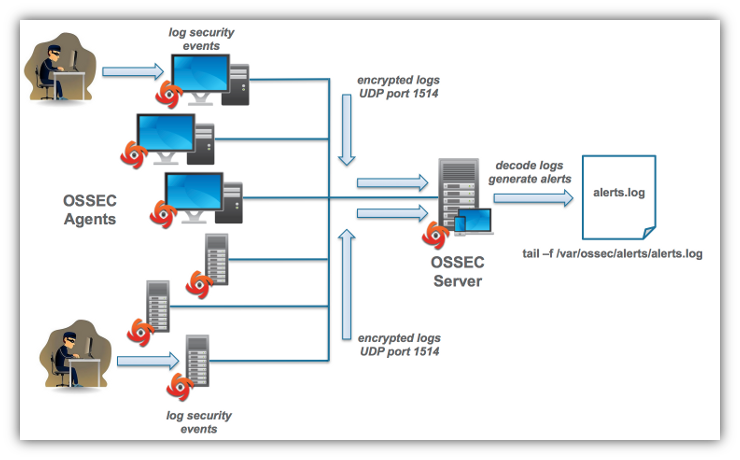
Logstash is configured to receive OSSEC syslog output then parse it and forward to Elasticsearch for indexing and long terms storage. Kibana is designed to easily submit queries to Elasticsearch and display results in a number of user designed dashboards. So the steps involved for developing an OSSEC log management system with Elasticsearch are:
- Configure OSSEC to output alerts to syslog
- Install and configure Logstash to input OSSEC alerts, parse them and input the fields to Elasticsearch.
- Install and configure Elasticsearch to store OSSEC alerts from Logstash.
- Install and configure Kibana to work with Elasticsearch.
All of these components could run on different systems, but to keep things simple, let’s install them on a single system.
Configure OSSEC Syslog Output
To keep this article as brief as possible, I won’t go over how to install OSSEC. That is well documented on the OSSEC Project website. To configure OSSEC to send alerts to another system via syslog follow these steps:
- Login as root to the OSSEC server.
- Open /var/ossec/etc/ossec.conf in an editor.
- Let’s assume you want to send the alerts to a syslog server at
10.0.0.1listening on UDP port9000. Add these lines to ossec.conf at the end of theossec_configsection:
    <syslog_output>
       <server>10.0.0.1</server>
       <port>9000</port>
       <format>default</format>
    </syslog_output>
- Enable syslog output:
/var/ossec/bin/ossec-control enable client-syslog
- Restart the OSSEC server:
/var/ossec/bin/ossec-control start
Install and Configure Logstash
The easiest way to install Elasticsearch is from RPMs or DEB packages. I use CentOS most of the time so I’ll discuss how to install from RPMs. Let’s start with Logstash.
- Download the Logstash RPM.
- Login as root.
- Run
rpm -Uvh logstash-version.rpmwhereversionis the version you want download.
Installing with RPMs or DEBs places the Logstash components in /usr/share/logstash.
Now Logstash needs to be configured to receive OSSEC syslog output on UDP port 9000 or whatever port you decide to use. The configuration file you need to capture and parse syslog input is an rsyslog recipe with a few tweaks for OSSEC derived from the blog by Dan Parriott, my colleague on the OSSEC Project team, who was an early adopter of Logstash and Elasticsearch:
1
2
3
4
5
6
7
8
9
10
11
12
13
14
15
16
17
18
19
20
21
22
23
24
25
26
27
28
input {
# stdin{}
  udp {
     port => 9000
     type => "syslog"
  }
}

filter {
  if [type] == "syslog" {
    grok {
      match => { "message" => "%{SYSLOGTIMESTAMP:syslog_timestamp} %{SYSLOGHOST:syslog_host} %{DATA:syslog_program}: Alert Level: %{BASE10NUM:Alert_Level}; Rule: %{BASE10NUM:Rule} - %{GREEDYDATA:Description}; Location: %{GREEDYDATA:Details}" }
      add_field => [ "ossec_server", "%{host}" ]
    }
    mutate {
      remove_field => [ "syslog_hostname", "syslog_message", "syslog_pid", "message", "@version", "type", "host" ]
    }
  }
}

output {
#  stdout {
#    codec => rubydebug
#  }
   elasticsearch_http {
     host => "10.0.0.1"
   }
}
Lines [1–7] Every Logstash syslog configuration file contains input, filter, and output sections. The input section in this case tells Logstash to listen for syslog UDP packets on any IP address and port 9000. For debugging you can uncomment line 2 to get input from stdin. This is handy when testing your parsing code in the filter section
Lines [9–11] The filter section divides up the incoming syslog lines that are placed in the Logstash input field called message with the match directive. Logstash grok filters do the basic pattern matching and parsing. You can get a detailed explanation of how grok works on the Logstash grok documentation page. The syntax for parsing fields is %{<pattern>:<field>}, where <pattern> is what will be searched for and <field> is the name of the field that is found.
Line [12] The syslog_timestamp, syslog_host, syslog_program, and syslog_pid fields are parsed first. The next three fields are specific to OSSEC: Alert_level, Rule, and Description. The remainder of the message is placed into Details. Here is the parsing sequence for these fields:
Alert_level– skip past the" Alert level: "string then extract the numeric characters up to the next space.Rule– skip past the" Rule: "string then extract the numeric characters up to the" – "string.Description– skip past the" - "string then extract any characters, including spaces, up to the"; Location: "string.Details– skip past the"; Location: "string then extract the remaining characters, including spaces, from the original"message"field.
Line [13] The host field, containing the name of the host on which Logstash is running is mapped to the logstash_host field with the add_field directive in grok.
Lines [15–17] All the fields are parsed so the extraneous fields are trimmed from the output with the remove_field directive in the mutate section.
Lines [21–24] The output section sends the parsed output to Elasticsearch or to stdout. You can uncomment codec => rubydebug statement to output the parsed fields in JSON format for debugging.
Lines [25–26] The elasticsearch_http directive sends the Logstash output to the Elasticsearch instance running at the IP address specified by the host field. In this case Elasticsearch is running at IP address 10.0.0.1.
If you store the Logstash configuration in your home directory in a file called logstash.conf and Logstash is installed in /usr/local/share/logstash, then you can start running Logstash like this:
/usr/share/logstash/bin/logstash -f ${HOME}/logstash.confInstall and Configure Elasticsearch
You can install Elasticsearch in a cluster, but to keep things simple, I’ll cover a single node installation.
- Download the Elasticsearch RPM.
- Login as root.
- Run
rpm -Uvh elasticsearch-version.rpmwhereversionis the version you want to download.
By default, the Elasticsearch files are maintained in /var/lib/elasticsearch and logs in /var/log/elasticsearch. You can change that in elasticsearch.yml, but for now leave them as is. However let’s set the name of the Elasticsearch cluster to mycluster to match the cluster name setting from the Logstash config file of the previous section. To do that open /etc/elasticsearch/elasticsearch.yml and set the following line as shown:
# Cluster name identifies your cluster for auto-discovery. If you're running
# multiple clusters on the same network, make sure you're using unique names.
#
cluster.name: mycluster
The RPM will install Elasticsearch in /usr/share/elasticsearch and the configuration files /etc/elasticsearch/elasticsearch.yml and /etc/sysconfig/elasticsearch. It also creates a service script to start, stop, and check the status of Elasticsearch. You can start and stop Elasticsearch with the service command:
service elasticsearch start|stop|statusIf you want to create a multi-node cluster checkout the Elasticsearch Definitive Guild chapter on Configuration.
Install and Configure Kibana
At this point you are able to collect OSSEC alerts and query them with the Elasticsearch RESTful API. But Elasticsearch provides a web console called Kibana which enables you to build consoles that post queries automatically to your Elasticsearch backend. To install and configure Kibana follow this procedure.
- Download the Kibana RPM.
- Login as root.
- Run
rpm -Uvh kibana-version.rpmwhereversionis the version you want to download. - Open the /opt/kibana/config.js file in an editor
- Change the URL in the
elasticsearchfield value to the IP address and TCP port of your Elasticsearch system. For example, if Elasticsearch is running on address10.0.0.1and port9200the URL would behttp://10.0.0.1:9200.
To test the installation, open the Kibana URL http://10.0.0.1/kibana/ in a browser. You should get a screen that looks like this:
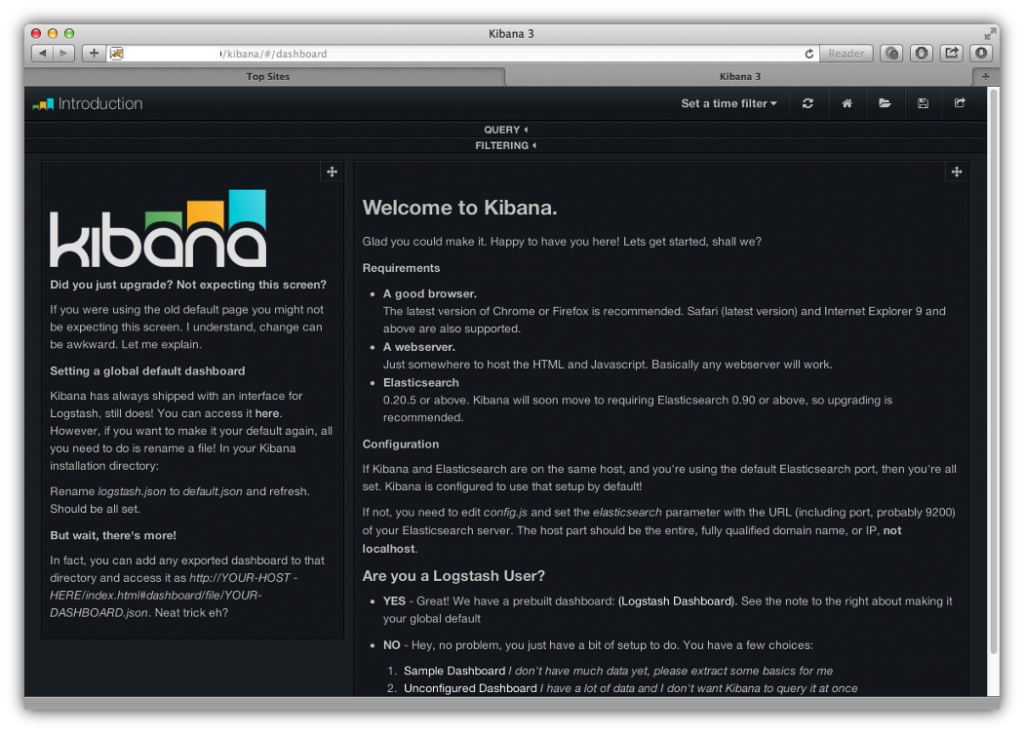
To get to the console screen, click on the Logstash Dashboard link in the Yes bullet point under Are you a Logstash User?
Query Elasticsearch with Kibana
If you let your OSSEC system run for a while you should have collected some alerts that were stored in Elasticsearch. After going to the Logstash Dashboard, you’ll see a screen that has some panels on it. The top panel queries Elasticsearch for all alerts by default.
To get specific alerts, you enter a query string for one of the OSSEC fields, such as Rule = 70001, then you’ll see the results in a the panel called EVENTS OVER TIME that shows counts of the events returned from Elasticsearch over time. You can do additional queries by clicking on the plus icon of the most recent query then entering the new query strings and clicking on the magnifying glass icon. The illustration below shows results for three queries that I entered looking for alerts for OSSEC rules 700001, 591 and 700012.
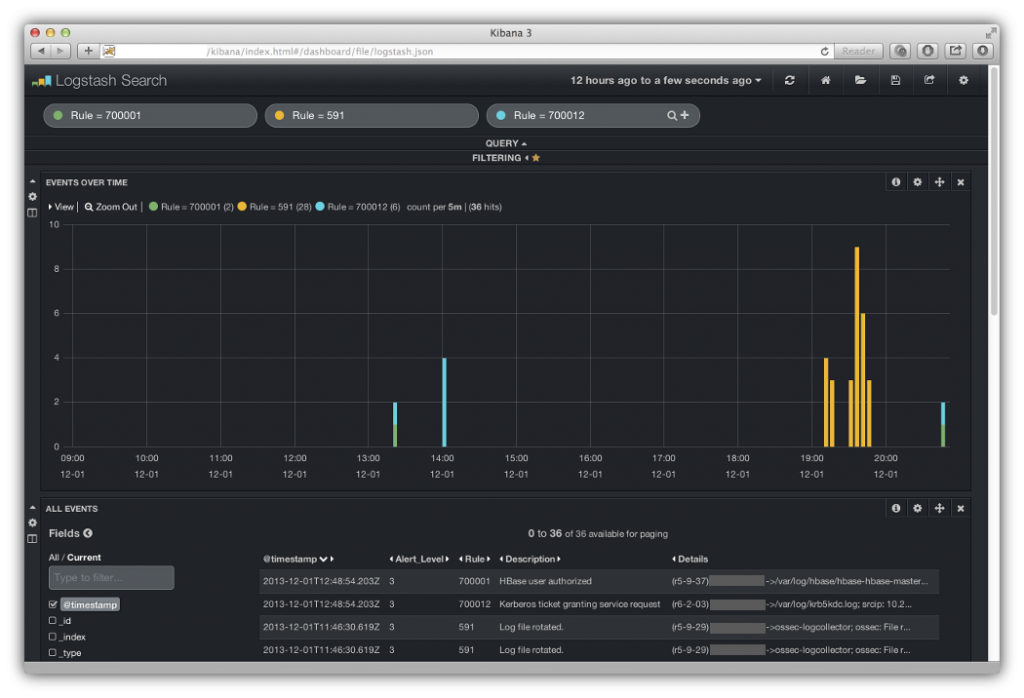
The alerts fields are displayed in the panel below EVENTS OVER TIME. You select the fields you want to see by clicking on the checkboxes for the fields you want to display in the Fields list shown in the lower left hand corner of the illustration. In this case, I’ve selected @timestamp, Alert_level, Rule, Description and Details.
As new alerts are stored in Elasticsearch, they will appear in the Kibana console if your refresh the screen in your browser. Alternatively you can have the console refresh automatically by clicking the time scale menu item, which is labeled a day ago to a few seconds ago, then select Auto-refresh > and one of the several refresh times ranging from seconds to 1 day. The panels will then refresh at every interval you specified and you should see new alerts pop up on the screen, assuming those OSSEC alerts are generated on your OSSEC agent systems.
When you get this system working try experimenting with different queries for other OSSEC alerts. I’ve just scratched the surface of what can be done with Elasticsearch.


Leave a comment